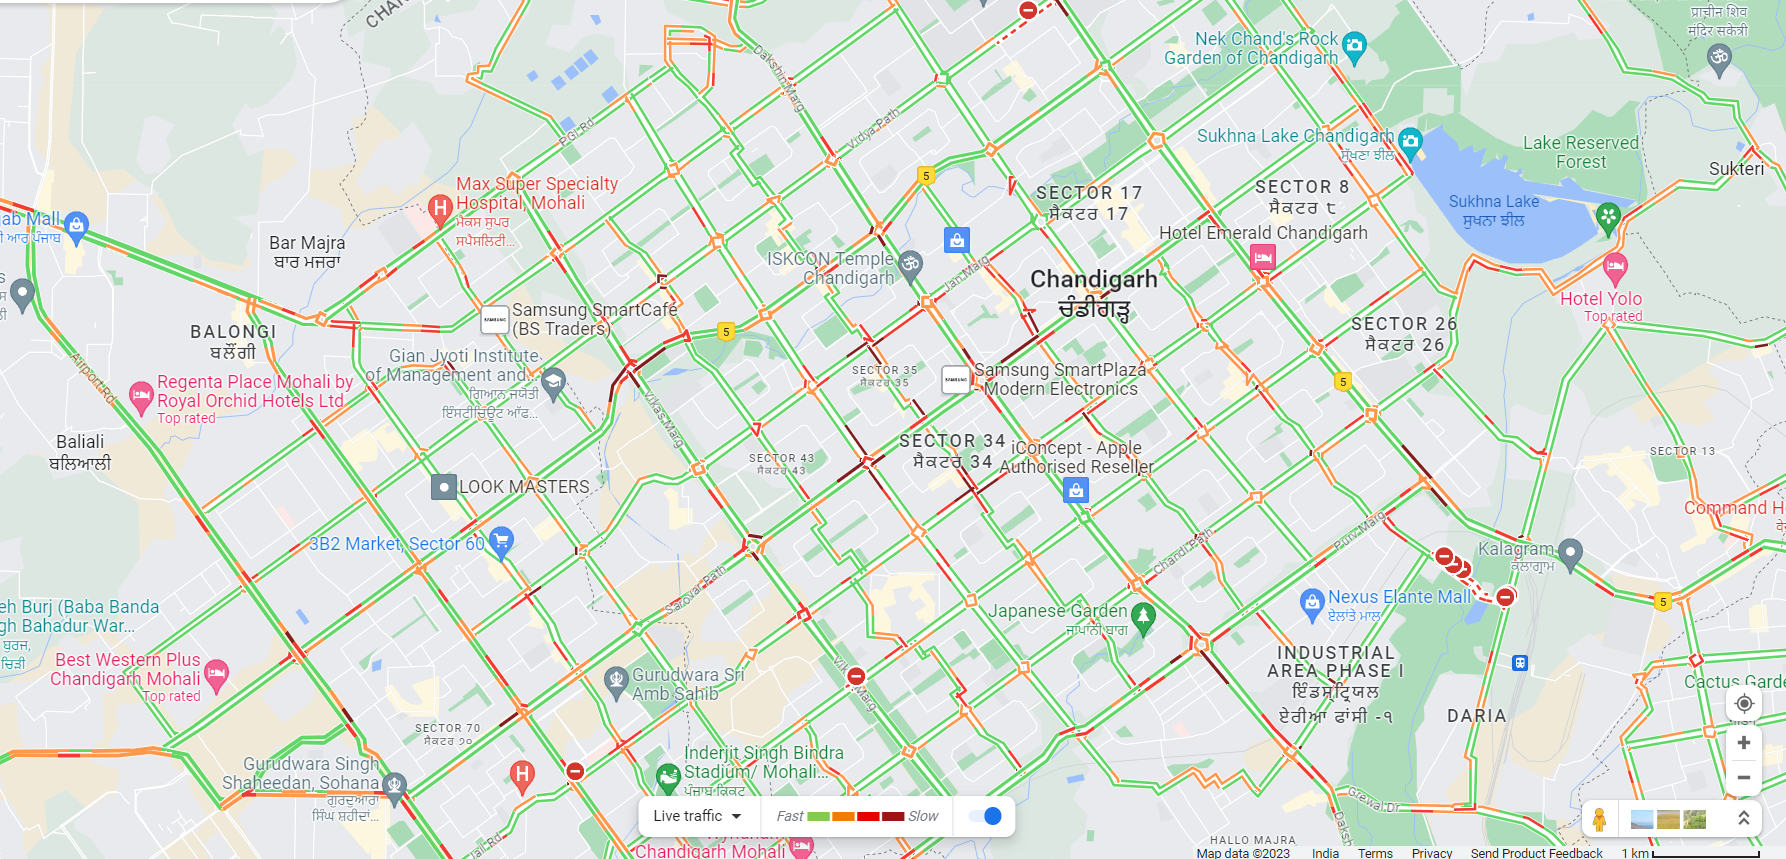
Chandigarh is one of the best planned Indian cities, having been built from scratch after India’s independence. It was meticulously planned by the renowned French architect, Le Corbusier, who was ably supported by an Indian team. It has a gridiron road network where roads run parallel and at right angles to each other, dividing the city into ‘sectors’. The major roads run NW (SE in the opposite direction) and minor roads run NE (SW in the opposite direction). Nearly all the major junctions of the city are roundabouts, which were originally free-flowing, but now most of them are governed by traffic signals. In the last 15 years, some of the roundabouts have even been removed by the administration and fully converted to regular traffic intersections governed by traffic signals.
Three years ago, I began venturing out on early-morning and late-evening cycling trips around Chandigarh, and was able to see the city much better than I did riding in a car. These trips also gave me a chance to observe roads and junctions and the movement of different kind of vehicles more closely, and I felt that the city’s traffic management could be and ought to be improved. Therefore, in February 2023 I voluntarily started exploring how traffic flow data could be extracted using the APIs of Google Maps. This could then be used to uncover traffic-flow patterns, which would provide an objective basis for proposing suggestions for improvement that I could submit to the city’s administration.
Such a live-data-capturing software could also be used by traffic managers for real-time monitoring and quick response. This could also be used as a tool by the planners to compare traffic-flow statistics before and after any change that is implemented.
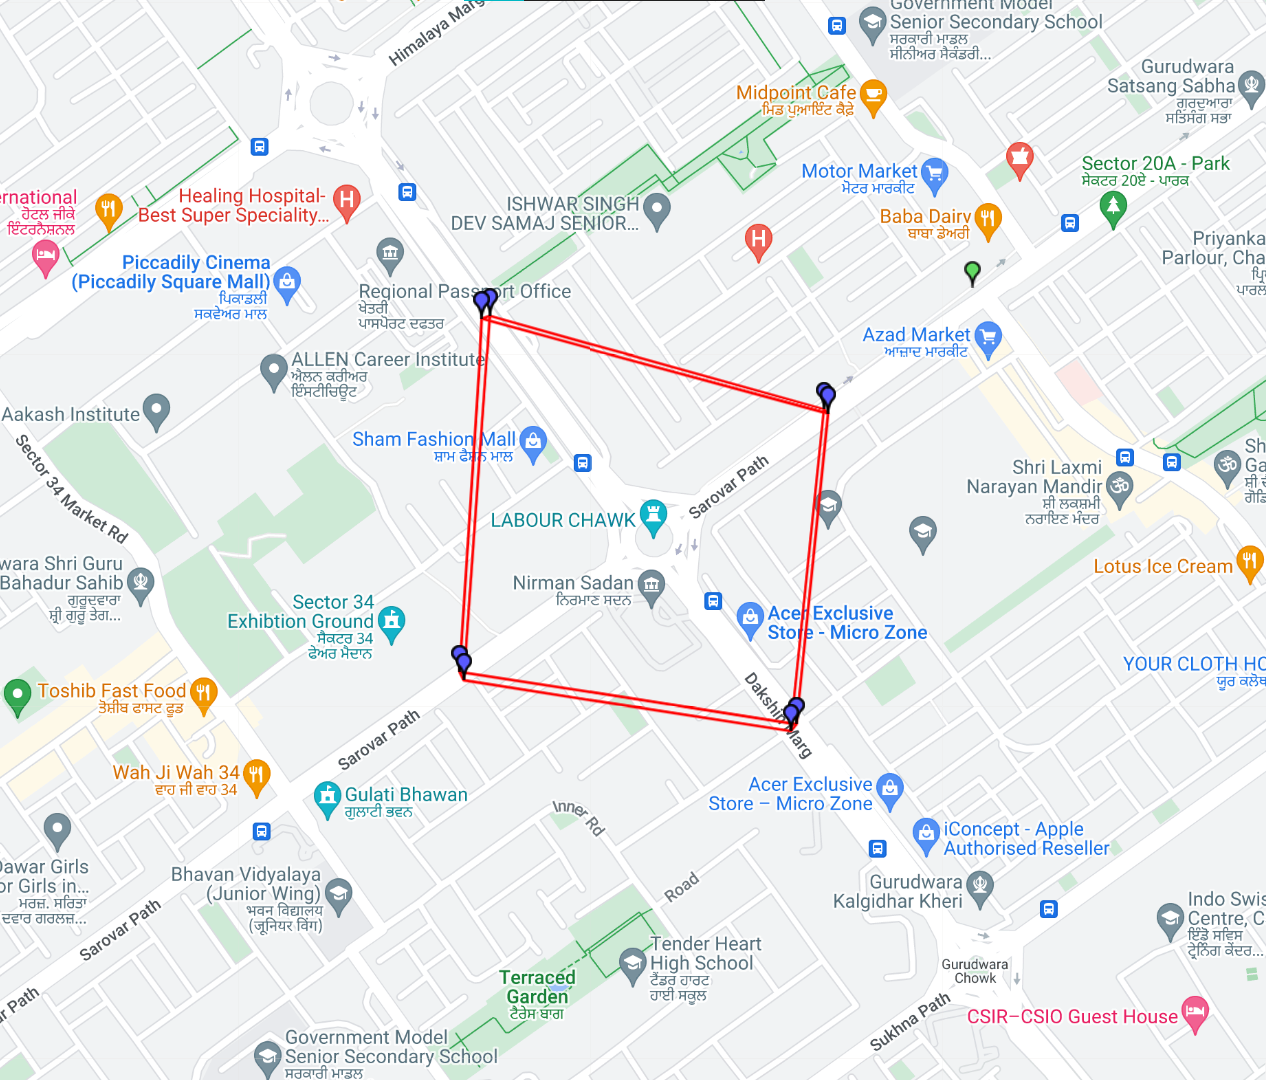
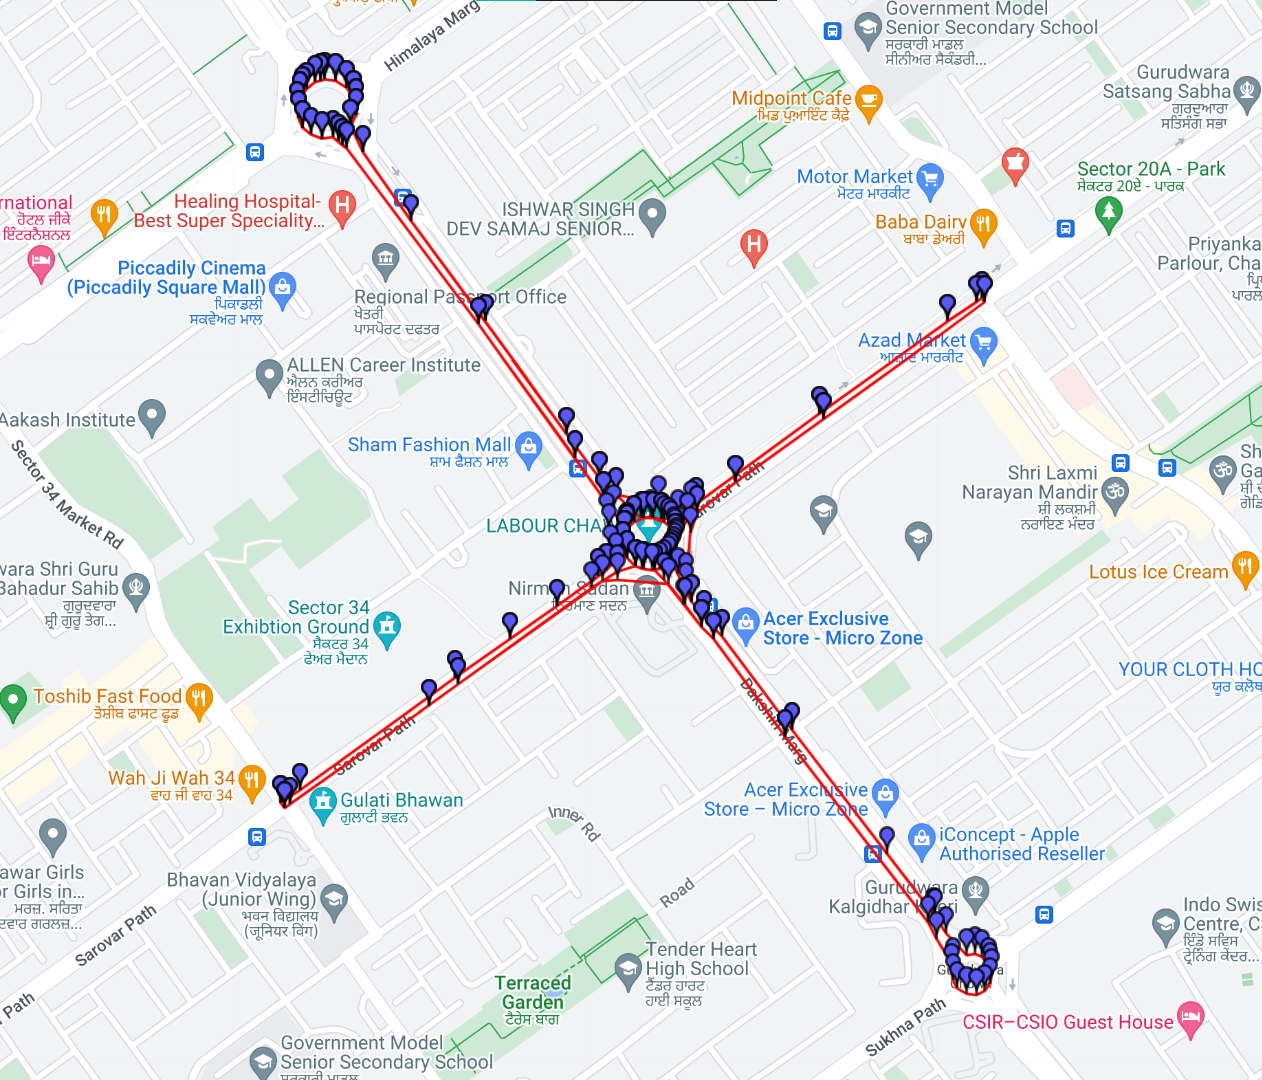
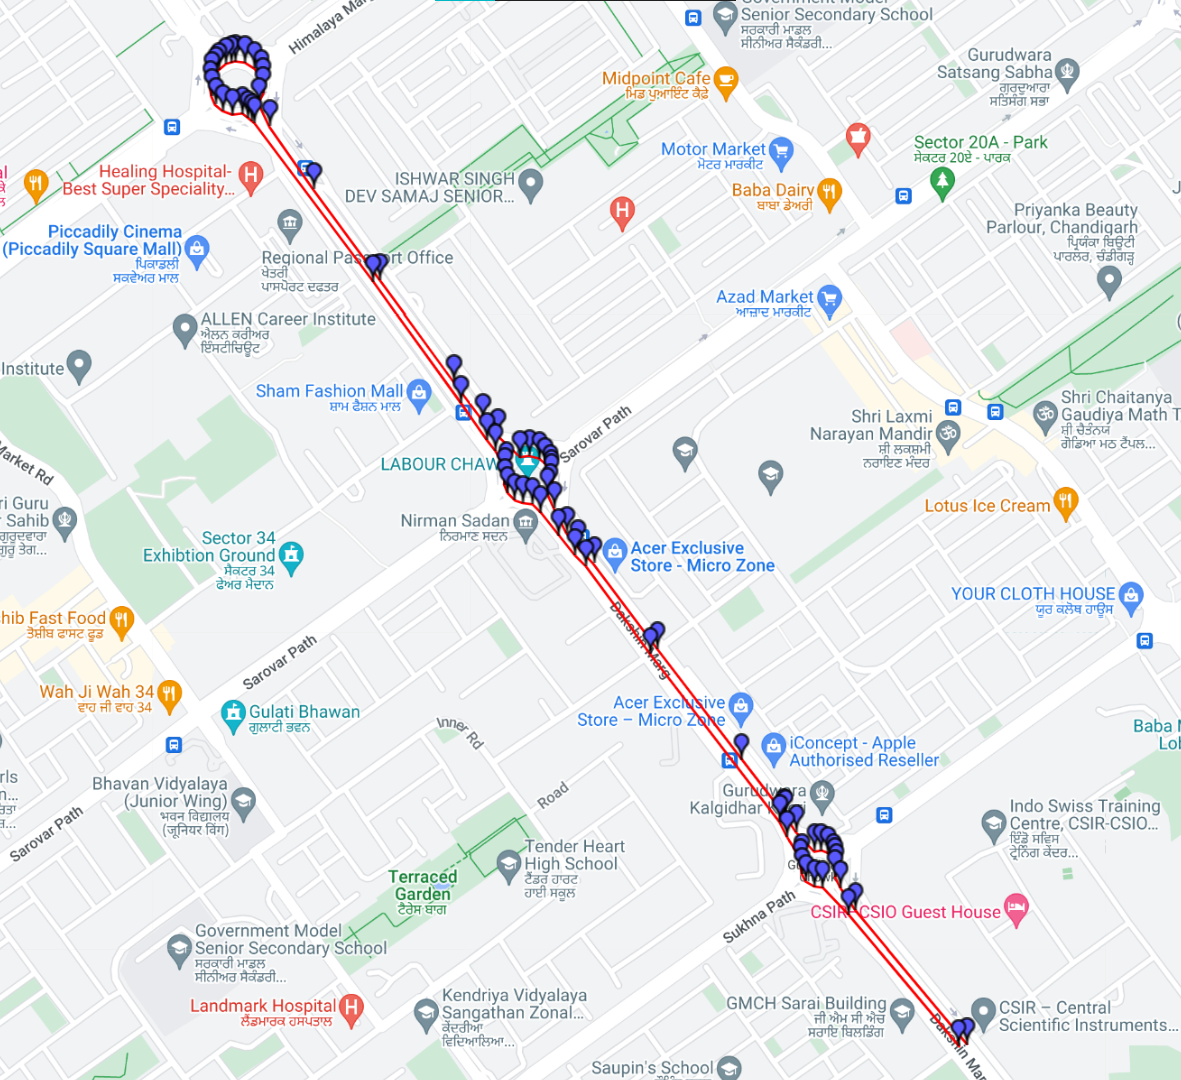
I have succeeded in writing code that sends automated requests to Google Maps and records their responses. To make it usable for Chandigarh, I also had to create a grid of locations on the city’s roads, for which I chose 364 waypoints and recorded their coordinates. Moreover, since Google Maps charges $0.015 for each request on their Routes API and allows for a monthly free usage of only $200, I had to optimize using these 13,333 free requests as best as possible to contain cost within the free limit. For this, instead of looking at each traffic junction individually, I opted to create 69 hypothetical routes traversing across the city and upon extracting information from the single response returned by Google for each of these, I was able to gather travel information for all maneuvers at each of the 129 major and semi-major junctions of the city. This was programmed to run at 16 specified times of the day, which I chose in a manner such that a picture of traffic-flow across peak and off-peak hours is obtained. Starting this on July 1, I was able to gather data for 12 days before I ran out of the free quota for the month.
Google returns data as a JSON string for the entire route that was queried. The route is defined in Google’s Encoded Polyline format and the response contains, among other things, the Distance, Duration and the Traffic-flow Conditions (Normal, Slow, Traffic Jam) for each sub-segment of the route queried by me. I wrote a separate program to extract this data from Google’s responses, thereby giving me information about the condition of traffic at each junction, when approached from and exited in any direction.
I have gathered this data for 12 days each across four months from July to October, 2023 and these are ~150,000 data points per month. I am presently in the process of writing code to extract statistics and patterns from this database, to present these to the city’s traffic planners.


